中商官网
中商官网
 数据库
数据库

2014 Deep Research Report on Global and China CCTV Lens Industry
2014 Deep Research Report on Global and China CCTV Lens Industry


<2014 Deep Research Report on Global and China CCTV Lens Industry> was professional and depth research report on Global and China CCTV Lens industry. In a word, it was a depth research report on China CCTV Lens industry. And thanks to the support and assistance from CCTV Lens industry chain related technical experts and marketing engineers during Research Team survey and interviews.
【Report Name】:2014 Deep Research Report on Global and China CCTV Lens Industry
【Published】:Nov/2014
【Report Code】:QY
【Report Pages】:361
【Report Charts】:289
【Form】: PDF or Hard copy
【Delivery】: E-mail or EMS
【Report Price】:Hard Copy: 2600 USD
PDF Copy (single user): 2600 USD
Global License: 5200USD
【Telephone】:0755-25407713 Online QQ:1113842166
company WEB SITE ://www.askci.com
【Abstract】:
<2014 Deep Research Report on Global and China CCTV Lens Industry> was professional and depth research report on Global and China CCTV Lens industry. The report firstly introduced CCTV Lens basic information included CCTV Lens definition classification application industry chain structure industry overview; international market analysis, China domestic market analysis, Macroeconomic environment and economic situation analysis, CCTV Lens industry policy and plan, CCTV Lens product specification, manufacturing process, cost structure etc. then statistics Global and China key manufacturers CCTV Lens capacity production cost price profit production value gross margin etc information, and Global and China CCTV Lens capacity production market share supply demand shortage import export consumption etc data statistics, and CCTV Lens 2009-2014 capacity production price cost profit production value gross margin etc information. And also listed CCTV Lens upstream raw materials and down stream analysis and CCTV Lens marketing channels industry development trend and proposals. In the end, The report introduced CCTV Lens new project SWOT analysis Investment feasibility analysis investment return analysis and also give related research conclusions and development trend analysis on China CCTV Lens industry. In a word, it was a depth research report on China CCTV Lens industry. And thanks to the support and assistance from CCTV Lens industry chain related technical experts and marketing engineers during Research Team survey and interviews.
Table of Contents
Chapter One CCTV Lens Industry Overview 1
1.1 CCTV Lens Definition 1
1.2 CCTV Lens Classification and Application 1
1.3 CCTV Lens Industry Chain Structure 3
1.4 CCTV Lens Industry Overview 3
1.5 CCTV Lens Industry Policy Analysis 3
1.6 CCTV Lens Industry News Analysis 3
Chapter Two CCTV Lens International and China Market Analysis 9
2.1 CCTV Lens Industry International Market Analysis 9
2.1.1 CCTV Lens International Market Development History 9
2.1.2 CCTV Lens Product and Technology Developments 11
2.1.3 CCTV Lens Competitive Landscape Analysis 15
2.1.4 CCTV Lens International Key Countries Development Status 18
2.1.5 CCTV Lens International Market Development Trend 19
2.2 CCTV Lens Industry China Market Analysis 19
2.2.1 CCTV Lens China Market Development History 19
2.2.2 CCTV Lens Product and Technology Developments 19
2.2.3 CCTV Lens Competitive Landscape Analysis 22
2.2.4 CCTV Lens China Key Regions Development Status 25
2.2.5 CCTV Lens China Market Development Trend 25
2.3 CCTV Lens International and China Market Comparison Analysis 26
Chapter Three CCTV Lens Technical Data and Manufacturing Plants Analysis 29
3.1 2014 Global Key Manufacturers CCTV Lens Capacity and Commercial Production Date 29
3.2 2014 Global Key Manufacturers CCTV Lens Manufacturing Plants Distribution 31
3.3 2014 Global Key Manufacturers CCTV Lens R&D Status and Technology Sources 32
3.4 2014 Global Key Manufacturers CCTV Lens Raw Materials Sources Analysis 34
Chapter Four CCTV Lens Production by Regions By Technology By Applications 35
4.1 2009-2014 CCTV Lens Production by Regions(such as US EU China Japan etc) 35
4.2 2009-2014 CCTV Lens Production by Technology(key type product) 39
4.3 2009-2014 CCTV Lens Production by Applications 39
4.4 2009-2014 CCTV Lens Price by key Manufacturers 39
4.5 2009-2014 US CCTV Lens Capacity Production Price Cost Production Value Analysis 41
4.6 2009-2014 German CCTV Lens Capacity Production Price Cost Production Value Analysis 41
4.7 2009-2014 Japan CCTV Lens Capacity Production Price Cost Production Value Analysis 42
4.8 2009-2014 China CCTV Lens Capacity Production Price Cost Production Value Analysis 42
4.9 2009-2014 US CCTV Lens Supply Import Export Consumption 43
4.10 2009-2014 German CCTV Lens Supply Import Export Consumption 43
4.11 2009-2014 Japan CCTV Lens Supply Import Export Consumption 43
4.12 2009-2014 China CCTV Lens Supply Import Export Consumption 44
Chapter Five CCTV Lens Manufacturing Process and Cost Structure 44
5.1 CCTV Lens Product Specifications 44
5.2 CCTV Lens Manufacturing Process Analysis 45
5.3 CCTV Lens Cost Structure Analysis 46
5.4 CCTV Lens Price Cost Gross Analysis 46
Chapter Six 2009-2014 CCTV Lens Productions Supply Sales Demand Market Status and Forecast 47
6.1 2009-2014 CCTV Lens Capacity Production Overview 47
6.2 2009-2014 CCTV Lens Production Market Share Analysis 58
6.3 2009-2014 CCTV Lens Demand Overview 68
6.4 2009-2014 CCTV Lens Supply Demand and Shortage 69
6.5 2009-2014 CCTV Lens Import Export Consumption 69
6.6 2009-2014 CCTV Lens Cost Price Production Value Gross Margin 70
Chapter Seven CCTV Lens Key Manufacturers Analysis 80
7.1 Tamron 80
7.1.1 Company Profile 80
7.1.2 Product Specification 82
7.1.3 Capacity Production Price Cost Production Value 91
7.1.4 Contact Information 92
7.2 CBC 93
7.2.1 Company Profile 93
7.2.2 Product Specification 95
7.2.3 Capacity Production Price Cost Production Value 99
7.2.4 Contact Information 101
7.3 Fujifilm 101
7.3.1 Company Profile 102
7.3.2 Product Specification 103
7.3.3 Capacity Production Price Cost Production Value 105
7.3.4 Contact Information 106
7.4 Avenir /Seiko 106
7.4.1 Company Profile 106
7.4.2 Product Specification 107
7.4.3 Capacity Production Price Cost Production Value 108
7.4.4 Contact Information 109
7.5 Tokina 109
7.5.1 Company Profile 109
7.5.2 Product Specification 112
7.5.3 Capacity Production Price Cost Production Value 115
7.5.4 Contact Information 116
7.6 ADL 116
7.6.1 Company Profile 117
7.6.2 Product Specification 118
7.6.3 Capacity Production Price Cost Production Value 132
7.6.4 Contact Information 134
7.7 Theia Technologies 135
7.7.1 Company Profile 135
7.7.2 Product Specification 136
7.7.3 Capacity Production Price Cost Production Value 137
7.7.4 Contact Information 138
7.8 Olympus 138
7.8.1 Company Profile 138
7.8.2 Product Specification 141
7.8.3 Capacity Production Price Cost Production Value 141
7.8.4 Contact Information 142
7.9 Kowa 143
7.9.1 Company Profile 143
7.9.2 Product Specification 145
7.9.3 Capacity Production Price Cost Production Value 152
7.9.4 Contact Information 154
7.10 Ricoh 154
7.10.1 Company Profile 154
7.10.2 Product Specification 158
7.10.3 Capacity Production Price Cost Production Value 161
7.10.4 Contact Information 162
7.11 Samsung 162
7.11.1 Company Profile 162
7.11.2 Product Specification 163
7.11.3 Capacity Production Price Cost Production Value 165
7.11.4 Contact Information 166
7.12 Myutron 167
7.12.1 Company Profile 167
7.12.2 Product Specification 168
7.12.3 Capacity Production Price Cost Production Value 175
7.12.4 Contact Information 176
7.13 EZspyCam 177
7.13.1 Company Profile 177
7.13.2 Product Specification 178
7.13.3 Capacity Production Price Cost Production Value 182
7.13.4 Contact Information 184
7.14 Sunex 184
7.14.1 Company Profile 184
7.14.2 Product Specification 186
7.14.3 Capacity Production Price Cost Production Value 187
7.14.4 Contact Information 189
7.15 Aperture Enterprise 189
7.15.1 Company Profile 189
7.15.2 Product Specification 190
7.15.3 Capacity Production Price Cost Production Value 190
7.15.4 Contact Information 192
7.16 Daiwon 192
7.16.1 Company Profile 192
7.16.2 Product Specification 194
7.16.3 Capacity Production Price Cost Production Value 195
7.16.4 Contact Information 197
7.17 Space 197
7.17.1 Company Profile 197
7.17.2 Product Specification 199
7.17.3 Capacity Production Price Cost Production Value 199
7.17.4 Contact Information 201
7.18 Samyang 202
7.18.1 Company Profile 202
7.18.2 Product Specification 203
7.18.3 Capacity Production Price Cost Production Value 204
7.18.4 Contact Information 206
7.19 FIFO Optics 206
7.19.1 Company Profile 206
7.19.2 Product Specification 207
7.19.3 Capacity Production Price Cost Production Value 209
7.19.4 Contact Information 210
7.20 Goyo Optical 210
7.20.1 Company Profile 211
7.20.2 Product Specification 212
7.20.3 Capacity Production Price Cost Production Value 212
7.20.4 Contact Information 214
7.21 VS Technology 215
7.21.1 Company Profile 215
7.21.2 Product Specification 217
7.21.3 Capacity Production Price Cost Production Value 221
7.21.4 Contact Information 222
7.22 Schneider Optics 222
7.22.1 Company Profile 222
7.22.2 Product Specification 224
7.22.3 Capacity Production Price Cost Production Value 225
7.22.4 Contact Information 227
7.23 Schott Moritex 227
7.23.1 Company Profile 227
7.23.2 Product Specification 228
7.23.3 Capacity Production Price Cost Production Value 230
7.23.4 Contact Information 232
7.24 ASIANTECH 232
7.24.1 Company Profile 232
7.24.2 Product Specification 233
7.24.3 Capacity Production Price Cost Production Value 234
7.24.4 Contact Information 236
7.25 Sharpen Vision Technology 236
7.25.1 Company Profile 236
7.25.2 Product Specification 237
7.25.3 Capacity Production Price Cost Production Value 239
7.25.4 Contact Information 240
7.26 Xiamen Leading Optics 240
7.26.1 Company Profile 241
7.26.2 Product Specification 241
7.26.3 Capacity Production Price Cost Production Value 246
7.26.4 Contact Information 248
7.27 Phenix Optical 248
7.27.1 Company Profile 249
7.27.2 Product Specification 250
7.27.3 Capacity Production Price Cost Production Value 253
7.27.4 Contact Information 255
7.28 RICOM Group 255
7.28.1 Company Profile 255
7.28.2 Product Specification 256
7.28.3 Capacity Production Price Cost Production Value 259
7.28.4 Contact Information 260
7.29 Fuzhou Senview 260
7.29.1 Company Profile 260
7.29.2 Product Specification 263
7.29.3 Capacity Production Price Cost Production Value 264
7.29.4 Contact Information 266
7.30 Feihua Optoelectronic 266
7.30.1 Company Profile 266
7.30.2 Product Picture and Specification 267
7.30.3 Capacity Production Price Cost Production Value 268
7.30.4 Contact Information 270
7.31 Ultrasonic 270
7.31.1 Company Profile 270
7.31.2 Product Picture and Specification 271
7.31.3 Capacity Production Price Cost Production Value 271
7.31.4 Contact Information 273
7.32 YTOT 273
7.32.1 Company Profile 273
7.32.2 Product Picture and Specification 274
7.32.3 Capacity Production Price Cost Production Value 274
7.32.4 Contact Information 276
7.33 Hongfa Optoelectronics 276
7.33.1 Company Profile 276
7.33.2 Product Picture and Specification 277
7.33.3 Capacity Production Price Cost Production Value 277
7.33.4 Contact Information 279
7.34 Huake Optical 279
7.34.1 Company Profile 279
7.34.2 Product Picture and Specification 280
7.34.3 Capacity Production Price Cost Production Value 281
7.34.4 Contact Information 282
7.35 Fuzhou Superior 282
7.35.1 Company Profile 282
7.35.2 Product Picture and Specification 283
7.35.3 Capacity Production Price Cost Production Value 285
7.35.4 Contact Information 286
7.36 FOCtek 286
7.36.1 Company Profile 287
7.36.2 Product Picture and Specification 288
7.36.3 Capacity Production Price Cost Production Value 289
7.36.4 Contact Information 290
7.37 Fuzhou Focusafe 291
7.37.1 Company Profile 291
7.37.2 Product Picture and Specification 292
7.37.3 Capacity Production Price Cost Production Value 294
7.37.4 Contact Information 295
7.38 Fuxin Optical 295
7.38.1 Company Profile 295
7.38.2 Product Picture and Specification 296
7.38.3 Capacity Production Price Cost Production Value 296
7.38.4 Contact Information 298
7.39 Lida Optical 298
7.39.1 Company Profile 298
7.39.2 Product Picture and Specification 299
7.39.3 Capacity Production Price Cost Production Value 300
7.39.4 Contact Information 301
7.40 Sunny Optical 301
7.40.1 Company Profile 302
7.40.2 Product Picture and Specification 303
7.40.3 Capacity Production Price Cost Production Value 304
7.40.4 Contact Information 306
Chapter Eight Up and Down Stream Industry Analysis 306
8.1 Upstream Raw Materials Price Analysis 306
8.1.1 Optical Lenses and Optical Glasses 306
8.1.2 Polycarbonate 310
8.1.3 PVC 312
8.2 Upstream Equipments Market Analysis 315
8.2.1 Glass Circle Cutting Machine 315
8.2.2 Shaped Glass Cutting Machine 316
8.3 Down Stream Demand Analysis 317
8.3.1 Video Surveillance Demand Analysis 317
8.4 Industry Chain Analysis 318
Chapter Nine CCTV Lens Marketing Channels Analysis 319
9.1 CCTV Lens Marketing Channels Status 319
9.2 CCTV Lens Marketing Channels Characteristic 319
9.3 CCTV Lens Marketing Channels Development Trend 320
Chapter Ten 2014-2019 CCTV Lens Productions Supply Sales Demand Market Status and Forecast 322
10.1 2014-2019 CCTV Lens Capacity Production Overview 322
10.2 2014-2019 CCTV Lens Production Market Share Analysis 325
10.3 2014-2019 CCTV Lens Demand Overview 329
10.4 2014-2019 CCTV Lens Supply Demand and Shortage 330
10.5 2014-2019 CCTV Lens Import Export Consumption 330
10.6 2014-2019 CCTV Lens Cost Price Production Value Gross Margin 331
Chapter Eleven CCTV Lens Industry Development Proposals 332
11.1 Macroeconomic Development Countermeasures 332
11.2 New Firms Enter Market Strategy 335
11.3 New Project Investment Proposals 337
11.4 Marketing Channel Strategy Proposals 338
11.5 Competitive Environment Strategy Proposals 339
Chapter Twelve CCTV Lens New Project Investment Feasibility Analysis 340
12.1 CCTV Lens Project SWOT Analysis 340
12.2 CCTV Lens New Project Investment Feasibility Analysis 341
12.2.1 Project Name 341
12.2.2 Investment budget 341
Chapter Thirteen Global and China CCTV Lens Industry Research 342
Tables and Figures
Figure CCTV Lens Product Picture 1
Table CCTV Lens Types Features and Application List 1
Figure CCTV Lens Industry Chain Structure 3
Table 2013 Global Key Manufacturers CCTV Lens Capacity and Market Share List 15
Table 2013 Global Key Manufacturers CCTV Lens Production and Market Share List 16
Table 2013 Global Key Manufacturers CCTV Lens Production Value and Market Share List 17
Figure 2013 Global Key Areas CCTV Lens Consumption Share 18
Figure 2009-2019 Global CCTV Lens Capacity Production and Growth Analysis 19
Table 2013 China Key Manufacturers CCTV Lens Capacity and Market Share List 22
Table 2013 China Key Manufacturers CCTV Lens Production and Market Share List 23
Table 2013 China Key Manufacturers CCTV Lens Production Value and Market Share List 24
Figure 2013 China Key Areas CCTV Lens Consumption Share 25
Figure 2009-2019 China CCTV Lens Capacity Production and Growth Analysis 25
Figure 2009-2019 Global and China CCTV Lens Capacity Comparison Analysis 26
Figure 2009-2019 Global and China CCTV Lens Production Comparison Analysis 27
Figure 2009-2019 Global and China CCTV Lens Production Value Comparison Analysis 27
Figure 2009-2019 Global and China CCTV Lens Price Comparison Analysis 28
Figure 2009-2019 Global and China CCTV Lens Gross margin Comparison Analysis 28
Table 2014 Global Key Manufacturers CCTV Lens Capacity (K Unit) 29
Table 2014 Global Key Manufacturers Fire-rated Commercial Production Date 30
Table 2014 Global Key Manufacturers CCTV Lens Manufacturing Plants Distribution 31
Table 2014 Global Key Manufacturers CCTV Lens R&D Status and Technology Sources 32
Table 2014 Global Key Manufacturers CCTV Lens Raw Materials Sources 34
Table 2009-2014 CCTV Lens Production (K Unit) by Regions 35
Figure 2009 Global CCTV Lens Production Market Share by Regions 36
Figure 2010 Global CCTV Lens Production Market Share by Regions 37
Figure 2011 Global CCTV Lens Production Market Share by Regions 37
Figure 2012 Global CCTV Lens Production Market Share by Regions 38
Figure 2013 Global CCTV Lens Production Market Share by Regions 38
Table 2009-2014 Global CCTV Lens Production (K Unit) by Type 39
Table 2009-2014 Global CCTV Lens Production (K Unit) by Applications 39
Table 2009-2014 Global Major Manufacturers CCTV Lens Price (USD/Unit) List 39
Table 2009-2014 US CCTV Lens Production (K Unit) Price Cost Profit (USD/Unit) Production Value (Million USD) Gross Margin List 41
Table 2009-2014 German CCTV Lens Production (K Unit) Price Cost Profit (USD/Unit) Production Value (Million USD) Gross Margin List 41
Table 2009-2014 Japan CCTV Lens Production (K Unit) Price Cost Profit (USD/Unit) Production Value (Million USD) Gross Margin List 42
Table 2009-2014 China CCTV Lens Production (K Unit) Price Cost Profit (USD/Unit) Production Value (Million USD) Gross Margin List 42
Table 2009-2014 US CCTV Lens Production Import Export (K Unit) Consumption List 43
Table 2009-2014 German CCTV Lens Production Import Export (K Unit) Consumption List 43
Table 2009-2014 Japan CCTV Lens Production Import Export (K Unit) Consumption List 43
Table 2009-2014 China CCTV Lens Production Import Export (K Unit) Consumption List 44
Table One of CCTV Lens Product Specifications List 44
Figure CCTV Lens manufacturing system 45
Figure CCTV Lens Manufacturing Process 45
Figure 2013 CCTV Lens Cost Structure 46
Table 2009-2014 Global CCTV Lens Price Cost Gross (USD/Unit) Gross Margin List 46
Table 2009-2014 China CCTV Lens Price Cost Gross (USD/Unit) Gross Margin List 46
Table 2009-2014 Global Major Manufacturers CCTV Lens Capacity and Total Capacity (K Unit) List 47
Table 2009-2014 Global Major Manufacturers CCTV Lens Capacity Market Share List 48
Table 2009-2014 Global Major Manufacturers CCTV Lens Production and Total Production (K Unit) List 49
Table 2009-2014 Global Major Manufacturers CCTV Lens Production Market Share List 50
Figure 2009-2014 Global CCTV Lens Capacity Production (K Unit) and Growth Rate 52
Figure 2009-2014 Global CCTV Lens Capacity Utilization Rate List 52
Table 2009-2014 China Major Manufacturers CCTV Lens Capacity and Total Capacity (K Unit) List 52
Table 2009-2014 China Major Manufacturers CCTV Lens Capacity Market Share List 53
Table 2009-2014 China Major Manufacturers CCTV Lens Production and Total Production (K Unit) List 54
Table 2009-2014 China Major Manufacturers CCTV Lens Production Market Share List 54
Figure 2009-2014 China CCTV Lens Capacity Production (K Unit) and Growth Rate 55
Figure 2009-2014 China CCTV Lens Capacity Utilization Rate List 55
Figure 2013 Global and China Key Manufacturers CCTV Lens Capacity and Market Share List 56
Figure 2013 Global and China Key Manufacturers CCTV Lens Production and Market Share List 57
Figure 2009 Global Major Manufacturers CCTV Lens Production Market Share 58
Figure 2010 Global Major Manufacturers CCTV Lens Production Market Share 59
Figure 2011 Global Major Manufacturers CCTV Lens Production Market Share 60
Figure 2012 Global Major Manufacturers CCTV Lens Production Market Share 61
Figure 2013 Global Major Manufacturers CCTV Lens Production Market Share 62
Figure 2009 China Major Manufacturers CCTV Lens Production Market Share 63
Figure 2010 China Major Manufacturers CCTV Lens Production Market Share 64
Figure 2011 China Major Manufacturers CCTV Lens Production Market Share 65
Figure 2012 China Major Manufacturers CCTV Lens Production Market Share 66
Figure 2013 China Major Manufacturers CCTV Lens Production Market Share 67
Figure 2009-2014 Global CCTV Lens Demand (K Unit) and Growth Rate 68
Figure 2009-2014 China CCTV Lens Demand (K Unit) and Growth Rate 68
Table 2009-2014 Global Different Area CCTV Lens Consumption Share List 69
Table 2009-2014 Global CCTV Lens Supply Demand Shortage (K Unit) List 69
Table 2009-2014 China CCTV Lens Supply Demand Shortage (K Unit) List 69
Table 2009-2014 China CCTV Lens Production Import Export (K Unit) Consumption List 69
Table 2009-2014 Global Major Manufacturers CCTV Lens Price (USD/Unit) List 70
Table 2009-2014 Global Major Manufacturers CCTV Lens Gross Margin List 71
Table 2009-2014 Global Major Manufacturers CCTV Lens Production Value (Million USD) List 72
Table 2009-2014 Global Major Manufacturers CCTV Lens Production Value Share List 73
Table 2009-2014 China Major Manufacturers CCTV Lens Price (USD/Unit) List 74
Table 2009-2014 China Major Manufacturers CCTV Lens Gross Margin List 75
Table 2009-2014 China Major Manufacturers CCTV Lens Production Value (Million USD) List 75
Table 2009-2014 China Major Manufacturers CCTV Lens Production Value Share List 76
Figure 2013 Global and China Key Manufacturers CCTV Lens Price (USD/Unit) List 77
Figure 2013 Global and China Key Manufacturers CCTV Lens Gross Margin List 78
Figure 2013 Global and China Key Manufacturers CCTV Lens Production Value and Market Share List 79
Table 2009-2014 Global CCTV Lens Capacity Production (K Unit) Price Cost Gross (USD/Unit) Production Value (Million USD) Gross Margin List 79
Table 2009-2014 China CCTV Lens Capacity Production (K Unit) Price Cost Gross (USD/Unit) Production Value (Million USD) Gross Margin List 80
Figure Tamron CCTV Lens Picture and Specifications 82
Table 2009-2014 Tamron Company CCTV Lens Capacity Production (K Unit) Price Cost Gross (USD/Unit) Production Value (Million USD) Gross Margin List 91
Figure 2009-2014 Tamron CCTV Lens Capacity Production (K Unit) and Growth Rate 91
Figure 2009-2014 Tamron CCTV Lens Production Global Market Share 92
Figure CBC CCTV Lens Picture and Specifications 95
Table 2009-2014 CBC Company CCTV Lens Capacity Production (K Unit) Price Cost Gross (USD/Unit) Production Value (Million USD) Gross Margin List 99
Figure 2009-2014 CBC CCTV Lens Capacity Production (K Unit) and Growth Rate 100
Figure 2009-2014 CBC CCTV Lens Production Global Market Share 100
Figure Fujifilm CCTV Lens Picture and Specifications 103
Table 2009-2014 Fujifilm Company CCTV Lens Capacity Production (K Unit) Price Cost Gross (USD/Unit) Production Value (Million USD) Gross Margin List 105
Figure 2009-2014 Fujifilm CCTV Lens Capacity Production (K Unit) and Growth Rate 105
Figure 2009-2014 Fujifilm CCTV Lens Production Global Market Share 106
Figure Avenir /Seiko CCTV Lens Picture and Specifications 107
Table 2009-2014 Avenir /Seiko Company CCTV Lens Capacity Production (K Unit) Price Cost Gross (USD/Unit) Production Value (Million USD) Gross Margin List 108
Figure 2009-2014 Avenir /Seiko CCTV Lens Capacity Production (K Unit) and Growth Rate 108
Figure 2009-2014 Avenir /Seiko CCTV Lens Production Global Market Share 109
Figure Tokina CCTV Lens Picture and Specifications 112
Table 2009-2014 Tokina Company CCTV Lens Capacity Production (K Unit) Price Cost Gross (USD/Unit) Production Value (Million USD) Gross Margin List 115
Figure 2009-2014 Tokina CCTV Lens Capacity Production (K Unit) and Growth Rate 115
Figure 2009-2014 Tokina CCTV Lens Production Global Market Share 116
Figure ADL CCTV Lens Picture and Specifications 118
Table 2009-2014 ADL Company CCTV Lens Capacity Production (K Unit) Price Cost Gross (USD/Unit) Production Value (Million USD) Gross Margin List 132
Figure 2009-2014 ADL CCTV Lens Capacity Production (K Unit) and Growth Rate 133
Figure 2009-2014 ADL CCTV Lens Production Global Market Share 134
Figure Theia Technologies CCTV Lens Picture and Specifications 136
Table 2009-2014 Theia Technologies Company CCTV Lens Capacity Production (K Unit) Price Cost Gross (USD/Unit) Production Value (Million USD) Gross Margin List 137
Figure 2009-2014 Theia Technologies CCTV Lens Capacity Production (K Unit) and Growth Rate 137
Figure 2009-2014 Theia Technologies CCTV Lens Production Global Market Share 138
Figure Olympus CCTV Lens Picture and Specifications 141
Table 2009-2014 Olympus Company CCTV Lens Capacity Production (K Unit) Price Cost Gross (USD/Unit) Production Value (Million USD) Gross Margin List 141
Figure 2009-2014 Olympus CCTV Lens Capacity Production (K Unit) and Growth Rate 142
Figure 2009-2014 Olympus CCTV Lens Production Global Market Share 142
Figure Kowa CCTV Lens Picture and Specifications 145
Table 2009-2014 Kowa Company CCTV Lens Capacity Production (K Unit) Price Cost Gross (USD/Unit) Production Value (Million USD) Gross Margin List 152
Figure 2009-2014 Kowa CCTV Lens Capacity Production (K Unit) and Growth Rate 153
Figure 2009-2014 Kowa CCTV Lens Production Global Market Share 154
Figure Ricoh CCTV Lens Picture and Specifications 158
Table 2009-2014 Ricoh Company CCTV Lens Capacity Production (K Unit) Price Cost Gross (USD/Unit) Production Value (Million USD) Gross Margin List 161
Figure 2009-2014 Ricoh CCTV Lens Capacity Production (K Unit) and Growth Rate 161
Figure 2009-2014 Ricoh CCTV Lens Production Global Market Share 162
Figure Samsung CCTV Lens Picture and Specifications 163
Table 2009-2014 Samsung Company CCTV Lens Capacity Production (K Unit) Price Cost Gross (USD/Unit) Production Value (Million USD) Gross Margin List 165
Figure 2009-2014 Samsung CCTV Lens Capacity Production (K Unit) and Growth Rate 166
Figure 2009-2014 Samsung CCTV Lens Production Global Market Share 166
Figure Myutron CCTV Lens Picture and Specifications 168
Table 2009-2014 Myutron Company CCTV Lens Capacity Production (K Unit) Price Cost Gross (USD/Unit) Production Value (Million USD) Gross Margin List 175
Figure 2009-2014 Myutron CCTV Lens Capacity Production (K Unit) and Growth Rate 176
Figure 2009-2014 Myutron CCTV Lens Production Global Market Share 176
Figure EZspyCam CCTV Lens Picture and Specifications 178
Table 2009-2014 EZspyCam Company CCTV Lens Capacity Production (K Unit) Price Cost Gross (USD/Unit) Production Value (Million USD) Gross Margin List 182
Figure 2009-2014 EZspyCam CCTV Lens Capacity Production (K Unit) and Growth Rate 183
Figure 2009-2014 EZspyCam CCTV Lens Production Global Market Share 183
Figure Sunex CCTV Lens Picture and Specifications 186
Table 2009-2014 Sunex Company CCTV Lens Capacity Production (K Unit) Price Cost Gross (USD/Unit) Production Value (Million USD) Gross Margin List 187
Figure 2009-2014 Sunex CCTV Lens Capacity Production (K Unit) and Growth Rate 188
Figure 2009-2014 Sunex CCTV Lens Production Global Market Share 188
Figure Aperture Enterprise CCTV Lens Picture and Specifications 190
Table 2009-2014 Aperture Enterprise Company CCTV Lens Capacity Production (K Unit) Price Cost Gross (USD/Unit) Production Value (Million USD) Gross Margin List 190
Figure 2009-2014 Aperture Enterprise CCTV Lens Capacity Production (K Unit) and Growth Rate 191
Figure 2009-2014 Aperture Enterprise CCTV Lens Production Global Market Share 191
Figure Daiwon CCTV Lens Picture and Specifications 194
Table 2009-2014 Daiwon Company CCTV Lens Capacity Production (K Unit) Price Cost Gross (USD/Unit) Production Value (Million USD) Gross Margin List 195
Figure 2009-2014 Daiwon CCTV Lens Capacity Production (K Unit) and Growth Rate 196
Figure 2009-2014 Daiwon CCTV Lens Production Global Market Share 196
Figure Space CCTV Lens Picture and Specifications 199
Table 2009-2014 Space Company CCTV Lens Capacity Production (K Unit) Price Cost Gross (USD/Unit) Production Value (Million USD) Gross Margin List 199
Figure 2009-2014 Space CCTV Lens Capacity Production (K Unit) and Growth Rate 200
Figure 2009-2014 Space CCTV Lens Production Global Market Share 201
Figure Samyang CCTV Lens Picture and Specifications 203
Table 2009-2014 Samyang Company CCTV Lens Capacity Production (K Unit) Price Cost Gross (USD/Unit) Production Value (Million USD) Gross Margin List 204
Figure 2009-2014 Samyang CCTV Lens Capacity Production (K Unit) and Growth Rate 205
Figure 2009-2014 Samyang CCTV Lens Production Global Market Share 205
Figure FIFO Optics CCTV Lens Picture and Specifications 207
Table 2009-2014 FIFO Optics Company CCTV Lens Capacity Production (K Unit) Price Cost Gross (USD/Unit) Production Value (Million USD) Gross Margin List 209
Figure 2009-2014 FIFO Optics CCTV Lens Capacity Production (K Unit) and Growth Rate 209
Figure 2009-2014 FIFO Optics CCTV Lens Production Global Market Share 210
Figure Goyo Optical CCTV Lens Picture and Specifications 212
Table 2009-2014 Goyo Optical Company CCTV Lens Capacity Production (K Unit) Price Cost Gross (USD/Unit) Production Value (Million USD) Gross Margin List 212
Figure 2009-2014 Goyo Optical CCTV Lens Capacity Production (K Unit) and Growth Rate 213
Figure 2009-2014 Goyo Optical CCTV Lens Production Global Market Share 214
Figure VS Technology CCTV Lens Picture and Specifications 217
Table 2009-2014 VS Technology Company CCTV Lens Capacity Production (K Unit) Price Cost Gross (USD/Unit) Production Value (Million USD) Gross Margin List 221
Figure 2009-2014 VS Technology CCTV Lens Capacity Production (K Unit) and Growth Rate 221
Figure 2009-2014 VS Technology CCTV Lens Production Global Market Share 222
Figure Schneider Optics CCTV Lens Picture and Specifications 224
Table 2009-2014 Schneider Optics Company CCTV Lens Capacity Production (K Unit) Price Cost Gross (USD/Unit) Production Value (Million USD) Gross Margin List 225
Figure 2009-2014 Schneider Optics CCTV Lens Capacity Production (K Unit) and Growth Rate 226
Figure 2009-2014 Schneider Optics CCTV Lens Production Global Market Share 226
Figure Schott Moritex CCTV Lens Picture and Specifications 228
Table 2009-2014 Schott Moritex Company CCTV Lens Capacity Production (K Unit) Price Cost Gross (USD/Unit) Production Value (Million USD) Gross Margin List 230
Figure 2009-2014 Schott Moritex CCTV Lens Capacity Production (K Unit) and Growth Rate 231
Figure 2009-2014 Schott Moritex CCTV Lens Production Global Market Share 231
Figure ASIANTECH CCTV Lens Picture and Specifications 233
Table 2009-2014 ASIANTECH Company CCTV Lens Capacity Production (K Unit) Price Cost Gross (USD/Unit) Production Value (Million USD) Gross Margin List 234
Figure 2009-2014 ASIANTECH CCTV Lens Capacity Production (K Unit) and Growth Rate 235
Figure 2009-2014 ASIANTECH CCTV Lens Production Global Market Share 235
Figure Sharpen Vision Technology CCTV Lens Picture and Specifications 237
Table 2009-2014 Sharpen Vision Technology Company CCTV Lens Capacity Production (K Unit) Price Cost Gross (USD/Unit) Production Value (Million USD) Gross Margin List 239
Figure 2009-2014 Sharpen Vision Technology CCTV Lens Capacity Production (K Unit) and Growth Rate 239
Figure 2009-2014 Sharpen Vision Technology CCTV Lens Production Global Market Share 240
Figure Xiamen Leading Optics CCTV Lens Picture and Specifications 241
Table 2009-2014 Xiamen Leading Optics Company CCTV Lens Capacity Production (K Unit) Price Cost Gross (USD/Unit) Production Value (Million USD) Gross Margin List 246
Figure 2009-2014 Xiamen Leading Optics CCTV Lens Capacity Production (K Unit) and Growth Rate 247
Figure 2009-2014 Xiamen Leading Optics CCTV Lens Production Global Market Share 247
Figure Phenix Optical CCTV Lens Picture and Specifications 250
Table 2009-2014 Phenix Optical Company CCTV Lens Capacity Production (K Unit) Price Cost Gross (USD/Unit) Production Value (Million USD) Gross Margin List 253
Figure 2009-2014 Phenix Optical CCTV Lens Capacity Production (K Unit) and Growth Rate 254
Figure 2009-2014 Phenix Optical CCTV Lens Production Global Market Share 254
Figure RICOM Group CCTV Lens Picture and Specifications 256
Table 2009-2014 RICOM Group Company CCTV Lens Capacity Production (K Unit) Price Cost Gross (USD/Unit) Production Value (Million USD) Gross Margin List 259
Figure 2009-2014 RICOM Group CCTV Lens Capacity Production (K Unit) and Growth Rate 259
Figure 2009-2014 RICOM Group CCTV Lens Production Global Market Share 260
Figure Fuzhou Senview CCTV Lens Picture and Specifications 263
Table 2009-2014 Fuzhou Senview Company CCTV Lens Capacity Production (K Unit) Price Cost Gross (USD/Unit) Production Value (Million USD) Gross Margin List 264
Figure 2009-2014 Fuzhou Senview CCTV Lens Capacity Production (K Unit) and Growth Rate 265
Figure 2009-2014 Fuzhou Senview CCTV Lens Production Global Market Share 266
Figure Feihua Optoelectronic CCTV Lens Product and Specification Picture 267
Table 2009-2014 Feihua Optoelectronic CCTV Lens Product Capacity Production (K Unit) Price Cost Gross (USD/Unit) Production Value (Million USD) Gross Margin List 268
Figure 2009-2014 Feihua Optoelectronic CCTV Lens Product Capacity Production (K Unit) and Growth Rate 269
Figure 2009-2014 Feihua Optoelectronic CCTV Lens Product Production Global Market Share 269
Figure Ultrasonic CCTV Lens Product Picture 271
Table 2009-2014 Ultrasonic CCTV Lens Product Capacity Production (K Unit) Price Cost Gross (USD/Unit) Production Value (Million USD) Gross Margin List 271
Figure 2009-2014 Ultrasonic CCTV Lens Product Capacity Production (K Unit) and Growth Rate 272
Figure 2009-2014 Ultrasonic CCTV Lens Product Production Global Market Share 272
Figure YTOT CCTV Lens Product Picture 274
Table 2009-2014 YTOT CCTV Lens Product Capacity Production (K Unit) Price Cost Gross (USD/Unit) Production Value (Million USD) Gross Margin List 274
Figure 2009-2014 YTOT CCTV Lens Product Capacity Production (K Unit) and Growth Rate 275
Figure 2009-2014 YTOT CCTV Lens Product Production Global Market Share 275
Figure Hongfa Optoelectronics CCTV Lens Product Picture 277
Table 2009-2014 Hongfa Optoelectronics CCTV Lens Product Capacity Production (K Unit) Price Cost Gross (USD/Unit) Production Value (Million USD) Gross Margin List 277
Figure 2009-2014 Hongfa Optoelectronics CCTV Lens Product Capacity Production (K Unit) and Growth Rate 278
Figure 2009-2014 Hongfa Optoelectronics CCTV Lens Product Production Global Market Share 278
Figure Huake Optical CCTV Lens Product Picture 280
Figure Huake Optical CCTV Lens Product Picture 280
Table 2009-2014 Huake Optical CCTV Lens Product Capacity Production (K Unit) Price Cost Gross (USD/Unit) Production Value (Million USD) Gross Margin List 281
Figure 2009-2014 Huake Optical CCTV Lens Product Capacity Production (K Unit) and Growth Rate 281
Figure 2009-2014 Huake Optical CCTV Lens Product Production Global Market Share 282
Figure Fuzhou Superior CCTV Lens Product and Specification Picture 283
Figure Fuzhou Superior CCTV Lens Product and Specification Picture 284
Table 2009-2014 Fuzhou Superior CCTV Lens Product Capacity Production (K Unit) Price Cost Gross (USD/Unit) Production Value (Million USD) Gross Margin List 285
Figure 2009-2014 Fuzhou Superior CCTV Lens Product Capacity Production (K Unit) and Growth Rate 285
Figure 2009-2014 Fuzhou Superior CCTV Lens Product Production Global Market Share 286
Figure FOCtek CCTV Lens Product Picture 288
Table 2009-2014 FOCtek CCTV Lens Product Capacity Production (K Unit) Price Cost Gross (USD/Unit) Production Value (Million USD) Gross Margin List 289
Figure 2009-2014 FOCtek CCTV Lens Product Capacity Production (K Unit) and Growth Rate 289
Figure 2009-2014 FOCtek CCTV Lens Product Production Global Market Share 290
Figure Fuzhou Focusafe CCTV Lens Product and Specification Picture 292
Figure Fuzhou Focusafe CCTV Lens Product and Specification Picture 293
Table 2009-2014 Fuzhou Focusafe CCTV Lens Product Capacity Production (K Unit) Price Cost Gross (USD/Unit) Production Value (Million USD) Gross Margin List 294
Figure 2009-2014 Fuzhou Focusafe CCTV Lens Product Capacity Production (K Unit) and Growth Rate 294
Figure 2009-2014 Fuzhou Focusafe CCTV Lens Product Production Global Market Share 295
Figure Fuxin Optical CCTV Lens Product Picture 296
Table 2009-2014 Fuxin Optical CCTV Lens Product Capacity Production (K Unit) Price Cost Gross (USD/Unit) Production Value (Million USD) Gross Margin List 296
Figure 2009-2014 Fuxin Optical CCTV Lens Product Capacity Production (K Unit) and Growth Rate 297
Figure 2009-2014 Fuxin Optical CCTV Lens Product Production Global Market Share 297
Figure Lida Optical CCTV Lens Product Picture 299
Table 2009-2014 Lida Optical CCTV Lens Product Capacity Production (K Unit) Price Cost Gross (USD/Unit) Production Value (Million USD) Gross Margin List 300
Figure 2009-2014 Lida Optical CCTV Lens Product Capacity Production (K Unit) and Growth Rate 300
Figure 2009-2014 Lida Optical CCTV Lens Product Production Global Market Share 301
Figure Sunny Optical CCTV Lens Product Picture 303
Figure Sunny Optical CCTV Lens Product Picture 303
Table Sunny Optical CCTV Lens Product Specification 303
Table 2009-2014 Sunny Optical CCTV Lens Product Capacity Production (K Unit) Price Cost Gross (USD/Unit) Production Value (Million USD) Gross Margin List 304
Figure 2009-2014 Sunny Optical CCTV Lens Product Capacity Production (K Unit) and Growth Rate 305
Figure 2009-2014 Sunny Optical CCTV Lens Product Production Global Market Share 305
Figure Optical Lenses Product Picture 306
Figure Optical Lenses in CCTV Lens 307
Figure Optical Lenses in CCTV Lens 307
Figure Polycarbonate Product Picture 310
Figure PVC Product Picture 312
Figure Glass Circle Cutting Machine Product Picture 315
Figure Shaped Glass Cutting Machine Product Picture 316
Figure Video Surveillance Product Picture 317
Figure CCTV Lens Industry Chain Structure 318
Figure CCTV Lens Marketing Channels Status 319
Figure 2014-2019 Global CCTV Lens Capacity Production (K Unit) and Growth Rate 322
Table 2014-2019 Global CCTV Lens Capacity Utilization Rate List 323
Figure 2014-2019 China CCTV Lens Capacity Production (K Unit) and Growth Rate 323
Table 2014-2019 China CCTV Lens Capacity Utilization Rate List 324
Figure 2014 Global Major Manufacturers CCTV Lens Production Market Share 325
Figure 2019 Global Major Manufacturers CCTV Lens Production Market Share 326
Figure 2014 China Major Manufacturers CCTV Lens Production Market Share 327
Figure 2019 China Major Manufacturers CCTV Lens Production Market Share 328
Figure 2014-2019 Global CCTV Lens Demand (K Unit) and Growth Rate 329
Figure 2014-2019 China CCTV Lens Demand (K Unit) and Growth Rate 329
Table 2014-2019 Global CCTV Lens Supply Demand Shortage (K Unit) List 330
Table 2014-2019 China CCTV Lens Supply Demand Shortage (K Unit) List 330
Table 2014-2019 China CCTV Lens Production Import Export (K Unit) Consumption List 330
Table 2014-2019 Global CCTV Lens Capacity Production (K Unit) Price Cost Gross (USD/Unit) Production Value (Million USD) Gross Margin List 331
Table 2014-2019 China CCTV Lens Capacity Production (K Unit) Price Cost Gross (USD/Unit) Production Value (Million USD) Gross Margin List 331
Table Macroeconomic Development Countermeasures Analysis 332
Table CCTV Lens New Firms Enter Market Strategy 335
Table CCTV Lens New Project Investment Proposals 337
Table CCTV Lens Marketing Channel Strategy Proposals 338
Table CCTV Lens Competitive Environment Strategy Proposals 338
Figure CCTV Lens marketing strategy recommendations 339
Table CCTV Lens Project SWOT Analysis 340
Table Total Investment of the 200 K Unit CCTV Lens project 341
Figure 200 Units set CCTV Lens project main technical and economic data 342
Figure 2009-2014 CCTV Lens Price Trend 342
本报告所有内容受法律保护,中华人民共和国涉外调查许可证:国统涉外证字第1454号。 本报告由中商产业研究院出品,报告版权归中商产业研究院所有。本报告是中商产业研究院的研究与统计成果,报告为有偿提供给购买报告的客户内部使用。未获得中商产业研究院书面授权,任何网站或媒体不得转载或引用,否则中商产业研究院有权依法追究其法律责任。如需订阅研究报告,请直接联系本网站,以便获得全程优质完善服务。 本报告目录与内容系中商产业研究院原创,未经本公司事先书面许可,拒绝任何方式复制、转载。 在此,我们诚意向您推荐鉴别咨询公司实力的主要方法。
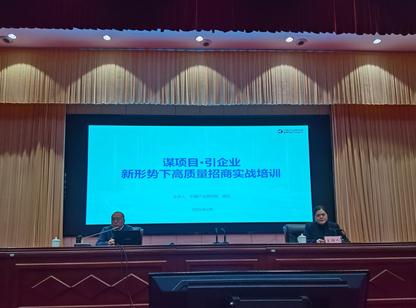
2月17日,遵义市招商营商业务专题培训会召开,中商产业董事长、研究院执行院长杨云(客座教授)应邀为培训...
2月17日,遵义市招商营商业务专题培训会召开,中商产业董事长、研究院执行院长杨云(客座教授)应邀为培训...
查看详情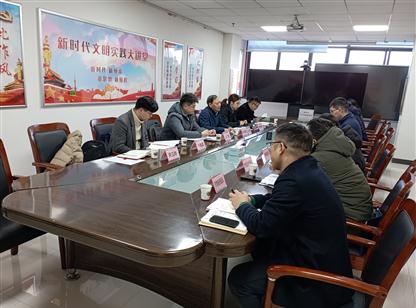
近日,中商产业研究院专家团队赴滁州市开展《滁州市制造业数字化、网络化、智能化、绿色化发展的堵点及对策...
近日,中商产业研究院专家团队赴滁州市开展《滁州市制造业数字化、网络化、智能化、绿色化发展的堵点及对策...
查看详情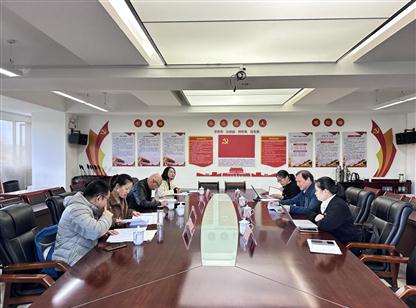
2024年12月27日,昆明市发展和改革委员会组织召开《“十五五”时期提升昆明服务业竞争力对策研究》专家评审...
2024年12月27日,昆明市发展和改革委员会组织召开《“十五五”时期提升昆明服务业竞争力对策研究》专家评审...
查看详情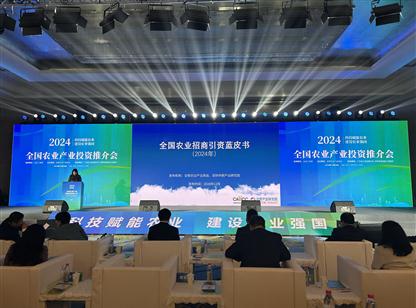
12月25日,2024年全国农业产业高质量发展大会暨2024年全国农业产业投资推介会在深圳市隆重开幕。此次盛会以...
12月25日,2024年全国农业产业高质量发展大会暨2024年全国农业产业投资推介会在深圳市隆重开幕。此次盛会以...
查看详情
近日,广东省云浮市政府党组成员、佛山市-云浮市对口帮扶协作指挥部指挥长,佛云园党工委书记、管委会主任...
近日,广东省云浮市政府党组成员、佛山市-云浮市对口帮扶协作指挥部指挥长,佛云园党工委书记、管委会主任...
查看详情
近日,湖北省随州市人民政府党组成员刘军伟一行莅临我院考察交流,会上刘军伟介绍了随州市的产业基础及现状...
近日,湖北省随州市人民政府党组成员刘军伟一行莅临我院考察交流,会上刘军伟介绍了随州市的产业基础及现状...
查看详情
12月18日,由贵州省人民政府驻广州办事处主办的省驻粤招商工作基金招商专题培训会在深圳中商产业研究院项目...
12月18日,由贵州省人民政府驻广州办事处主办的省驻粤招商工作基金招商专题培训会在深圳中商产业研究院项目...
查看详情
12月13日下午,河北省发展和改革委员会规划处、人事处组织开展发改大讲堂“十五五”规划编制系列专题培训,...
12月13日下午,河北省发展和改革委员会规划处、人事处组织开展发改大讲堂“十五五”规划编制系列专题培训,...
查看详情