中商官网
中商官网
 数据库
数据库

2014 Market Research Report on South Africa Waterproof Paint Industry
2014 Market Research Report on South Africa Waterproof Paint Industry
<2014 Market Research Report on South Africa Waterproof Paint Industry> was professional and depth research report on South Africa Waterproof Paint industry. The report firstly introduced Waterproof Paint basic information included Waterproof Paint definition classification application industry chain structure industry overview;
Then introduce South Africa Key players 2009-2014 Waterproof Paint Capacity Production Price Cost Gross Production Value Gross Margin etc Data and information.
And the report also listed South Africa regional 2009-2014 Waterproof Paint consumption and different regions trading business and regional import export and location regions consumption, and also listed South Africa total data.
Besides supply and demand side data by regions, the report also introduced different technology product output and different applications consumption (2009-2014). After market data by players by technology by applications by regions, the report also introduced product picture and specifications, different product type selling price, regional average selling price and South Africa average selling price (2009-2014). And also introduced South Africa average cost (2009-2014) and 2014 cost structure.
And then, the report also introduced product technology development and market data (production price cost etc) 2014-2020 forecast. In the end, the report introduced South Africa Waterproof Paint new project SWOT analysis and Investment feasibility analysis and also give related research conclusions.
In a word, it was a depth research report on South Africa Waterproof Paint industry. And most of the report data source from directly interview and industry association or public companies finance reports etc official and reliable data source. And also thanks the support and assistance of related technical experts and marketing engineers during Research Team survey and interviews.
【Report Name】:2014 Market Research Report on South Africa Waterproof Paint Industry
【Published】:Sep/2014
【Report Code】:QY
【Report Pages】:189
【Report Charts】:241
【Form】: PDF or Hard copy
【Delivery】: E-mail or EMS
【Report Price】:Hard Copy: 3600 USD
PDF Copy (single user): 3600 USD
Global License (enterprise license): 7000USD
【Telephone】:0755-25407713 Online QQ:1113842166
company WEB SITE ://www.askci.com
【Abstract】:
<2014 Market Research Report on South Africa Waterproof Paint Industry> was professional and depth research report on South Africa Waterproof Paint industry. The report firstly introduced Waterproof Paint basic information included Waterproof Paint definition classification application industry chain structure industry overview;
Then introduce South Africa Key players 2009-2014 Waterproof Paint Capacity Production Price Cost Gross Production Value Gross Margin etc Data and information.
And the report also listed South Africa regional 2009-2014 Waterproof Paint consumption and different regions trading business and regional import export and location regions consumption, and also listed South Africa total data.
Besides supply and demand side data by regions, the report also introduced different technology product output and different applications consumption (2009-2014).
After market data by players by technology by applications by regions, the report also introduced product picture and specifications, different product type selling price, regional average selling price and South Africa average selling price (2009-2014). And also introduced South Africa average cost (2009-2014) and 2014 cost structure.
And then, the report also introduced product technology development and market data (production price cost etc) 2014-2020 forecast.
In the end, the report introduced South Africa Waterproof Paint new project SWOT analysis and Investment feasibility analysis and also give related research conclusions.
In a word, it was a depth research report on South Africa Waterproof Paint industry. And most of the report data source from directly interview and industry association or public companies finance reports etc official and reliable data source. And also thanks the support and assistance of related technical experts and marketing engineers during Research Team survey and interviews.
Table of Contents
Chapter One Waterproof Paint Industry Overview
1.1 Waterproof Paint Definition
1.2 Waterproof Paint Classification and Application
1.3 Waterproof Paint Industry Chain Structure
1.4 Waterproof Paint Industry Overview
Chapter Two Waterproof Paint Development Environmental Analysis
2.1 South Africa Economic Environment Analysis
2.1.1 South Africa GDP Analysis
2.1.2 South Africa CPI Analysis
2.1.3 South Africa Urban and Rural Incomes Analysis
2.1.4 South Africa Total Retail Sales of Consumer Goods Analysis
2.1.5 South Africa Investment in Fixed Assets Analysis
2.1.6 South Africa The Total Value of Imports and Exports of Goods Analysis
2.1.7 2014 South Africa Macroeconomic Forecast
2.2 European Economic Environmental Analysis
2.3 United States Economic Environmental Analysis
2.4 Japan Economic Environmental Analysis
2.5 Global Economic Environmental Analysis
Chapter Three Global Waterproof Paint Market Status Analysis
3.1 Global Waterproof Paint Productions Supply Sales and Price Demand Market Analysis
3.1.1 2009-2014 Waterproof Paint Production and Capacity Status
3.1.2 2009-2014 Waterproof Paint Sales and Price Market Status
3.1.3 2009-2014 Waterproof Paint Supply Demand and Shortage
3.1.4 2009-2014 Waterproof Paint Cost Price Production Value Gross Margin
3.1.5 2009-2014 Waterproof Paint Industry Segment Market Status
3.1.6 Global market research conclusion
Chapter Four South Africa Waterproof Paint Market Status Analysis
4.1 South Africa Waterproof Paint Productions Supply Sales and Price Demand Market Analysis
4.1.1 2009-2014 Waterproof Paint Production and Capacity Status
4.1.2 2009-2014 Waterproof Paint Sales and Price Market Status
4.1.3 2009-2014 Waterproof Paint Supply Demand and Shortage
4.1.4 2009-2014 Waterproof Paint Cost Price Production Value Gross Margin
4.1.5 2009-2014 Waterproof Paint Industry Segment Market Status
4.1.6 South Africa market research conclusion
Chapter Five Major Companies Waterproof Paint Market Status and Analysis
5.1 Sika-Design
5.1.1 Company Profile
5.1.2 Product Picture and Specification
5.1.3 Capacity Production Price Cost Production Value
5.1.4 Contact Information
5.2 Mapei
5.2.1 Company Profile
5.2.2 Product Picture and Specification
5.2.3 Capacity Production Price Cost Production Value
5.2.4 Contact Information
5.3 Nippon Paint
5.3.1 Company Profile
5.3.2 Product Picture and Specification
5.3.3 Capacity Production Price Cost Production Value
5.3.4 Contact Information
5.4 Dupont
5.4.1 Company Profile
5.4.2 Product Picture and Specification
5.4.3 Capacity Production Price Cost Production Value
5.4.4 Contact Information
5.5 BASF
5.5.1 Company Profile
5.5.2 Product Picture and Specification
5.5.3 Capacity Production Price Cost Production Value
5.5.4 Contact Information
5.6 NeverWet
5.6.1 Company Profile
5.6.2 Product Picture and Specification
5.6.3 Capacity Production Price Cost Production Value
5.6.4 Contact Information
5.7 Dulux
5.7.1 Company Profile
5.7.2 Product Picture and Specification
5.7.3 Capacity Production Price Cost Production Value
5.7.4 Contact Information
5.8 METROPOLE
5.8.1 Company Profile
5.8.2 Product Picture and Specification
5.8.3 Capacity Production Price Cost Production Value
5.8.4 Contact Information
5.9 DRYLOK
5.9.1 Company Profile
5.9.2 Product Picture and Specification
5.9.3 Capacity Production Price Cost Production Value
5.9.4 Contact Information
5.10 RUST-OLEUM
5.10.1 Company Profile
5.10.2 Product Picture and Specification
5.10.3 Capacity Production Price Cost Production Value
5.10.4 Contact Information
5.11 AMES
5.11.1 Company Profile
5.11.2 Product Picture and Specification
5.11.3 Capacity Production Price Cost Production Value
5.11.4 Contact Information
5.12 PAREX
5.12.1 Company Profile
5.12.2 Product Picture and Specification
5.12.3 Capacity Production Price Cost Production Value
5.12.4 Contact Information
5.13 ZINSSER
5.13.1 Company Profile
5.13.2 Product Picture and Specification
5.13.3 Capacity Production Price Cost Production Value
5.13.4 Contact Information
5.14 KILZ
5.14.1 Company Profile
5.14.2 Product Picture and Specification
5.14.3 Capacity Production Price Cost Production Value
5.14.4 Contact Information
5.15 Liquid Rubber
5.15.1 Company Profile
5.15.2 Product Picture and Specification
5.15.3 Capacity Production Price Cost Production Value
5.15.4 Contact Information
5.16 Sandtex
5.16.1 Company Profile
5.16.2 Product Picture and Specification
5.16.3 Capacity Production Price Cost Production Value
5.16.4 Contact Information
5.17 ASTEC
5.17.1 Company Profile
5.17.2 Product Picture and Specification
5.17.3 Capacity Production Price Cost Production Value
5.17.4 Contact Information
5.18 Asianpaints
5.18.1 Company Profile
5.18.2 Product Picture and Specification
5.18.3 Capacity Production Price Cost Production Value
5.18.4 Contact Information
5.19 Berger
5.19.1 Company Profile
5.19.2 Product Picture and Specification
5.19.3 Capacity Production Price Cost Production Value
5.19.4 Contact Information
5.20 NANPAO RESINS
5.20.1 Company Profile
5.20.2 Product Picture and Specification
5.20.3 Capacity Production Price Cost Production Value
5.20.4 Contact Information
5.21 OZEKI CHEMICAL INDUSTRY CO.,LTD.
5.21.1 Company Profile
5.21.2 Product Picture and Specification
5.21.3 Capacity Production Price Cost Production Value
5.21.4 Contact Information
5.22 SEALPRO
5.22.1 Company Profile
5.22.2 Product Picture and Specification
5.22.3 Capacity Production Price Cost Production Value
5.22.4 Contact Information
5.23 PLASCON
5.23.1 Company Profile
5.23.2 Product Picture and Specification
5.23.3 Capacity Production Price Cost Production Value
5.23.4 Contact Information
5.24 Duram
5.24.1 Company Profile
5.12.2 Product Picture and Specification
5.24.3 Capacity Production Price Cost Production Value
5.24.4 Contact Information
5.25 WeatherPrufe
5.25.1 Company Profile
5.25.2 Product Picture and Specification
5.25.3 Capacity Production Price Cost Production Value
5.25.4 Contact Information
5.26 Kings
5.26.1 Company Profile
5.26.2 Product Picture and Specification
5.26.3 Capacity Production Price Cost Production Value
5.26.4 Contact Information
5.27 Paintcor
5.27.1 Company Profile
5.27.2 Product Picture and Specification
5.27.3 Capacity Production Price Cost Production Value
5.27.4 Contact Information
5.28 Weber
5.28.1 Company Profile
5.28.2 Product Picture and Specification
5.28.3 Capacity Production Price Cost Production Value
5.28.4 Contact Information
5.29 Megabond
5.29.1 Company Profile
5.29.2 Product Picture and Specification
5.29.3 Capacity Production Price Cost Production Value
5.29.4 Contact Information
5.30 Dampsure
5.30.1 Company Profile
5.30.2 Product Picture and Specification
5.30.3 Capacity Production Price Cost Production Value
5.30.4 Contact Information
5.31 MEDAL
5.31.1 Company Profile
5.31.2 Product Picture and Specification
5.31.3 Capacity Production Price Cost Production Value
5.31.4 Contact Information
5.32 HERITAGE
5.32.1 Company Profile
5.32.2 Product Picture and Specification
5.32.3 Capacity Production Price Cost Production Value
5.32.4 Contact Information
5.33 STONCOR
5.33.1 Company Profile
5.33.2 Product Picture and Specification
5.33.3 Capacity Production Price Cost Production Value
5.33.4 Contact Information
5.34 DEKOR
5.34.1 Company Profile
5.34.2 Product Picture and Specification
5.34.3 Capacity Production Price Cost Production Value
5.34.4 Contact Information
5.35 Darachem
5.35.1 Company Profile
5.35.2 Product Picture and Specification
5.35.3 Capacity Production Price Cost Production Value
5.35.4 Contact Information
5.36 ROBEX SA
5.36.1 Company Profile
5.36.2 Product Picture and Specification
5.36.3 Capacity Production Price Cost Production Value
5.36.4 Contact Information
5.37 RETEK
5.37.1 Company Profile
5.37.2 Product Picture and Specification
5.37.3 Capacity Production Price Cost Production Value
5.37.4 Contact Information
Chapter Six Waterproof Paint Industry Chain and Marketing Channels Analysis
6.1 Waterproof Paint Industry chain structure Analysis
6.2 Upstream Major Raw Materials Price 2009-2014
6.3 Upstream Key Suppliers Analysis
6.4 Down Steam Applications Scale 2009-2014
6.5 Down Stream Key Clients Analysis
6.6 Waterproof Paint Marketing Channels Status
6.7 Waterproof Paint Marketing Channels Characteristic
6.8 Waterproof Paint Marketing Channels Development Trend
Chapter Seven Waterproof Paint Industry Segment Market Analysis
7.1 Waterproof Paint Industry Sub-Product Market Structure
7.2 2009-2014 Waterproof Paint Industry Segment Polyurethane waterproof paint Market Sales and Price Status
7.3 2009-2014 Waterproof Paint Industry Segment Polymer cement-based waterproof paint Market Sales and Price Status
Chapter Eight Waterproof Paint Industry Development Trend
8.1 2014-2020 Waterproof Paint Demand Forecast
8.2 2014-2020 Waterproof Paint Production and Capacity Forecast
8.3 2014-2020 Waterproof Paint Cost Price Production Value Gross Margin Forecast
8.4 2014-2020 Waterproof Paint Industry Segment Market Status
Chapter Nine Waterproof Paint New Project Investment Feasibility Analysis
9.1 Waterproof Paint Project SWOT Analysis
9.2 Waterproof Paint New Project Investment Feasibility Analysis
Chapter Ten South Africa Waterproof Paint Industry Research Conclusions
Tables and Figures
Figure Waterproof Paint Product Picture
Table Waterproof Paint Types Features and Application List
Figure Waterproof Paint Industry Chain Structure
Figure 2007-2013 South Africa GDP (100 million ZAR) and Growth Rate
Figure 2007-2013 South Africa CPI Change Trend
Figure 2007-2013 South Africa Urban and Rural Incomes (ZAR)
Figure 2007-2013 South Africa Total Retail Sales of Consumer Goods (100 million ZAR) and Growth Rate
Figure 2007-2013 South Africa Investment in Fixed Assets (100 million ZAR) and Growth Rate
Figure 2007-2013 South Africa The Total Value of Imports and Exports of Goods (100 million ZAR) and Growth Rate
Table 2014 South Africa Macroeconomic Forecast Key Indicators (%)
Figure 2007-2013 EU27 GDP Growth Rate
Figure 2007-2013 EU27 HICP Index (The month of year-on-year)
Figure 2007-2013 United States GDP (100 million USD)
Figure 2007-2013 United States CPI
Figure 2007-2013 Japan GDP (Billion Yen)
Figure 2007-2013 Japan CPI (The month of year-on-year)
Table 2009-2014 Global Major Manufacturers Waterproof Paint Capacity and Total Capacity (K Ton)
Table 2009-2014 Global Major Manufacturers Waterproof Paint Capacity Market Share
Table 2009-2014 Global Major Manufacturers Waterproof Paint Production and Total Production (K Ton)
Table 2009-2014 Global Major Manufacturers Waterproof Paint Production Market Share
Figure 2009-2014 Global Waterproof Paint Capacity Production (K Ton) and Growth Rate
Table 2009-2014 Global Waterproof Paint Capacity Utilization Rate List
Table 2009-2014 Global Major Manufacturers Waterproof Paint Sales and Total Sales (K Ton)
Table 2009-2014 Global Major Manufacturers Waterproof Paint Sales Market Share
Figure 2009-2014 Global Waterproof Paint Sales (K Ton) and Growth Rate
Table 2009-2014 Global Waterproof Paint Sales-Output Ratio
Table 2009-2014 Global Major Manufacturers Waterproof Paint Price (USD/Ton)
Table 2009-2014 Global Waterproof Paint Demand (K Ton) and Growth Rate
Table 2009-2014 Global Waterproof Paint Supply Demand and Shortage (K Ton)
Table 2009-2014 Global Waterproof Paint Capacity Production (K Ton) Price Cost Gross (USD/Ton) Production Value (Million USD) Gross Margin List
Figure Waterproof Paint Industry Segment Market Structure (by Region)
Figure Waterproof Paint Industry Segment Market Structure (by Product)
Table 2009-2014 South Africa Major Manufacturers Waterproof Paint Capacity and Total Capacity (K Ton)
Table 2009-2014 South Africa Major Manufacturers Waterproof Paint Capacity Market Share
Table 2009-2014 South Africa Major Manufacturers Waterproof Paint Production and Total Production (K Ton)
Table 2009-2014 South Africa Major Manufacturers Waterproof Paint Production Market Share
Figure 2009-2014 South Africa Waterproof Paint Capacity Production (K Ton) and Growth Rate
Table 2009-2014 South Africa Waterproof Paint Capacity Utilization Rate List
Table 2009-2014 South Africa Major Manufacturers Waterproof Paint Sales and Total Sales (K Ton)
Table 2009-2014 South Africa Major Manufacturers Waterproof Paint Sales Market Share
Figure 2009-2014 South Africa Waterproof Paint Sales (K Ton) and Growth Rate
Table 2009-2014 South Africa Waterproof Paint Sales-Output Ratio
Table 2009-2014 South Africa Major Manufacturers Waterproof Paint Price (USD/Ton)
Table 2009-2014 South Africa Waterproof Paint Demand (K Ton) and Growth Rate
Table 2009-2014 South Africa Waterproof Paint Supply Demand and Shortage (K Ton)
Table 2009-2014 South Africa Waterproof Paint Capacity Production (K Ton) Price Cost Gross (USD/Ton) Production Value (Million USD) Gross Margin List
Figure Waterproof Paint Industry Segment Market Structure (by Region)
Figure Waterproof Paint Industry Segment Market Structure (by Product)
Figure Sika-Design Waterproof Paint Product Picture
Table Sika-Design Waterproof Paint Product Specification
Table 2009-2014 Sika-Design Waterproof Paint Product Capacity Production(K Ton) Price Cost Gross (USD/Ton) Production Value(Million USD) Gross Margin List
Figure 2009-2014 Sika-Design Waterproof Paint Product Capacity Production (K Ton) and Growth Rate
Figure 2009-2014 Sika-Design Waterproof Paint Product Production Global Market Share
Figure Mapei Waterproof Paint Product Picture
Table Mapei Waterproof Paint Product Specification
Table 2009-2014 Mapei Waterproof Paint Product Capacity Production(K Ton) Price Cost Gross (USD/Ton) Production Value(Million USD) Gross Margin List
Figure 2009-2014 Mapei Waterproof Paint Product Capacity Production (K Ton) and Growth Rate
Figure 2009-2014 Mapei Waterproof Paint Product Production Global Market Share
Figure Nippon Paint Waterproof Paint Product Picture
Table Nippon Paint Waterproof Paint Product Specification
Table 2009-2014 Nippon Paint Waterproof Paint Product Capacity Production(K Ton) Price Cost Gross (USD/Ton) Production Value(Million USD) Gross Margin List
Figure 2009-2014 Nippon Paint Waterproof Paint Product Capacity Production (K Ton) and Growth Rate
Figure 2009-2014 Nippon Paint Waterproof Paint Product Production Global Market Share
Figure Dupont Waterproof Paint Product Picture
Table Dupont Waterproof Paint Product Specification
Table 2009-2014 Dupont Waterproof Paint Product Capacity Production (K Ton) Price Cost Gross (USD/Ton) Production Value(Million USD) Gross Margin List
Figure 2009-2014 Dupont Waterproof Paint Product Capacity Production (K Ton) and Growth Rate
Figure 2009-2014 Dupont Waterproof Paint Product Production Global Market Share
Figure BASF Waterproof Paint Product Picture
Table BASF Waterproof Paint Product Specification
Table 2009-2014 BASF Waterproof Paint Product Capacity Production(K Ton) Price Cost Gross (USD/Ton) Production Value(Million USD) Gross Margin List
Figure 2009-2014 BASF Waterproof Paint Product Capacity Production (K Ton) and Growth Rate
Figure 2009-2014 BASF Waterproof Paint Product Production Global Market Share
Figure NeverWet Waterproof Paint Product Picture
Table NeverWet Waterproof Paint Product Specification
Table 2009-2014 NeverWet Waterproof Paint Product Capacity Production (K Ton) Price Cost Gross (USD/Ton) Production Value (Million USD) Gross Margin List
Figure 2009-2014 NeverWet Waterproof Paint Product Capacity Production (K Ton) and Growth Rate
Figure 2009-2014 NeverWet Waterproof Paint Product Production Global Market Share
Figure Dulux Waterproof Paint Product Picture
Table Dulux Waterproof Paint Product Specification
Table 2009-2014 Dulux Waterproof Paint Product Capacity Production (K Ton) Price Cost Gross (USD/Ton) Production Value (Million USD) Gross Margin List
Figure 2009-2014 Dulux Waterproof Paint Product Capacity Production (K Ton) and Growth Rate
Figure 2009-2014 Dulux Waterproof Paint Product Production Global Market Share
Figure METROPOLE Waterproof Paint Product Picture
Table METROPOLE Waterproof Paint Product Specification
Table 2009-2014 METROPOLE Waterproof Paint Product Capacity Production(K Ton) Price Cost Gross (USD/Ton) Production Value(Million USD) Gross Margin List
Figure 2009-2014 METROPOLE Waterproof Paint Product Capacity Production (K Ton) and Growth Rate
Figure 2009-2014 METROPOLE Waterproof Paint Product Production Global Market Share
Figure DRYLOKWaterproof Paint Product Picture
Table DRYLOK Waterproof Paint Product Specification
Table 2009-2014 DRYLOK Waterproof Paint Product Capacity Production (K Ton) Price Cost Gross (USD/Ton) Production Value (Million USD) Gross Margin List
Figure 2009-2014 DRYLOK Waterproof Paint Product Capacity Production (K Ton) and Growth Rate
Figure 2009-2014 DRYLOK Waterproof Paint Product Production Global Market Share
Figure RUST-OLEUM Waterproof Paint Product Picture
Table RUST-OLEUM Waterproof Paint Product Specification
Table 2009-2014 RUST-OLEUM Waterproof Paint Product Capacity Production (K Ton) Price Cost Gross (USD/Ton) Production Value (Million USD) Gross Margin List
Figure 2009-2014 RUST-OLEUM Waterproof Paint Product Capacity Production (K Ton) and Growth Rate
Figure 2009-2014 RUST-OLEUM Waterproof Paint Product Production Global Market Share
Figure AMES Waterproof Paint Product Picture
Table AMES Waterproof Paint Product Specification
Table 2009-2014 AMES Waterproof Paint Product Capacity Production (K Ton) Price Cost Gross (USD/Ton) Production Value (Million USD) Gross Margin List
Figure 2009-2014 AMES Waterproof Paint Product Capacity Production (K Ton) and Growth Rate
Figure 2009-2014 AMES Waterproof Paint Product Production Global Market Share
Figure PAREX Waterproof Paint Product Picture
Table PAREX Waterproof Paint Product Specification
Table 2009-2014 PAREX Waterproof Paint Product Capacity Production (K Ton) Price Cost Gross (USD/Ton) Production Value (Million USD) Gross Margin List
Figure 2009-2014 PAREX Waterproof Paint Product Capacity Production (K Ton) and Growth Rate
Figure 2009-2014 PAREX Waterproof Paint Product Production Global Market Share
Figure ZINSSER Waterproof Paint Product Picture
Table ZINSSER Waterproof Paint Product Specification
Table 2009-2014 ZINSSER Waterproof Paint Product Capacity Production (K Ton) Price Cost Gross (USD/Ton) Production Value (Million USD) Gross Margin List
Figure 2009-2014 ZINSSER Waterproof Paint Product Capacity Production (K Ton) and Growth Rate
Figure 2009-2014 ZINSSER Waterproof Paint Product Production Global Market Share
Figure KILZ Waterproof Paint Product Picture
Table KILZ Waterproof Paint Product Specification
Table 2009-2014 KILZ Waterproof Paint Product Capacity Production (K Ton) Price Cost Gross (USD/Ton) Production Value (Million USD) Gross Margin List
Figure 2009-2014 KILZ Waterproof Paint Product Capacity Production (K Ton) and Growth Rate
Figure 2009-2014 KILZ Waterproof Paint Product Production Global Market Share
Figure Liquid Rubber Waterproof Paint Product Picture
Table Liquid Rubber Waterproof Paint Product Specification
Table 2009-2014 Liquid Rubber Waterproof Paint Product Capacity Production (K Ton) Price Cost Gross (USD/Ton) Production Value (Million USD) Gross Margin List
Figure 2009-2014 Liquid Rubber Waterproof Paint Product Capacity Production (K Ton) and Growth Rate
Figure 2009-2014 Liquid Rubber Waterproof Paint Product Production Global Market Share
Figure Sandtex Waterproof Paint Product Picture
Table Sandtex Waterproof Paint Product Specification
Table 2009-2014 Sandtex Waterproof Paint Product Capacity Production (K Ton) Price Cost Gross (USD/Ton) Production Value (Million USD) Gross Margin List
Figure 2009-2014 Sandtex Waterproof Paint Product Capacity Production (K Ton) and Growth Rate
Figure 2009-2014 Sandtex Waterproof Paint Product Production Global Market Share
Figure ASTEC Waterproof Paint Product Picture
Table ASTEC Waterproof Paint Product Specification
Table 2009-2014 ASTEC Waterproof Paint Product Capacity Production (K Ton) Price Cost Gross (USD/Ton) Production Value (Million USD) Gross Margin List
Figure 2009-2014 ASTEC Waterproof Paint Product Capacity Production (K Ton) and Growth Rate
Figure 2009-2014 ASTEC Waterproof Paint Product Production Global Market Share
Figure Asianpaints Waterproof Paint Product Picture
Table Asianpaints Waterproof Paint Product Specification
Table 2009-2014 Asianpaints Waterproof Paint Product Capacity Production (K Ton) Price Cost Gross (USD/Ton) Production Value (Million USD) Gross Margin List
Figure 2009-2014 Asianpaints Waterproof Paint Product Capacity Production (K Ton) and Growth Rate
Figure 2009-2014 Asianpaints Waterproof Paint Product Production Global Market Share
Figure Berger Waterproof Paint Product Picture
Table Berger Waterproof Paint Product Specification
Table 2009-2014 Berger Waterproof Paint Product Capacity Production (K Ton) Price Cost Gross (USD/Ton) Production Value (Million USD) Gross Margin List
Figure 2009-2014 Berger Waterproof Paint Product Capacity Production (K Ton) and Growth Rate
Figure 2009-2014 Berger Waterproof Paint Product Production Global Market Share
Figure NANPAO RESINS Waterproof Paint Product Picture
Table NANPAO RESINS Waterproof Paint Product Specification
Table 2009-2014 NANPAO RESINS Waterproof Paint Product Capacity Production (K Ton) Price Cost Gross (USD/Ton) Production Value (Million USD) Gross Margin List
Figure 2009-2014 NANPAO RESINS Waterproof Paint Product Capacity Production (K Ton) and Growth Rate
Figure 2009-2014 NANPAO RESINS Waterproof Paint Product Production Global Market Share
Figure OZEKI CHEMICAL INDUSTRY CO.,LTD. Waterproof Paint Product Picture
Table OZEKI CHEMICAL INDUSTRY CO.,LTD. Waterproof Paint Product Specification
Table 2009-2014 OZEKI CHEMICAL INDUSTRY CO.,LTD. Waterproof Paint Product Capacity Production (K Ton) Price Cost Gross (USD/Ton) Production Value (Million USD) Gross Margin List
Figure 2009-2014 OZEKI CHEMICAL INDUSTRY CO.,LTD. Waterproof Paint Product Capacity Production (K Ton) and Growth Rate
Figure 2009-2014 OZEKI CHEMICAL INDUSTRY CO.,LTD. Waterproof Paint Product Production Global Market Share
Figure SEALPRO Waterproof Paint Product Picture
Table SEALPRO Waterproof Paint Product Specification
Table 2009-2014 SEALPRO Waterproof Paint Product Capacity Production (K Ton) Price Cost Gross (USD/Ton) Production Value (Million USD) Gross Margin List
Figure 2009-2014 SEALPRO Waterproof Paint Product Capacity Production (K Ton) and Growth Rate
Figure 2009-2014 SEALPRO Waterproof Paint Product Production Global Market Share
Figure PLASCON Waterproof Paint Product Picture
Table PLASCON Waterproof Paint Product Specification
Table 2009-2014 PLASCON Waterproof Paint Product Capacity Production (K Ton) Price Cost Gross (USD/Ton) Production Value (Million USD) Gross Margin List
Figure 2009-2014 PLASCON Waterproof Paint Product Capacity Production (K Ton) and Growth Rate
Figure 2009-2014 PLASCON Waterproof Paint Product Production Global Market Share
Figure Duram Waterproof Paint Product Picture
Table Duram Waterproof Paint Product Specification
Table 2009-2014 Duram Waterproof Paint Product Capacity Production (K Ton) Price Cost Gross (USD/Ton) Production Value (Million USD) Gross Margin List
Figure 2009-2014 Duram Waterproof Paint Product Capacity Production (K Ton) and Growth Rate
Figure 2009-2014 Duram Waterproof Paint Product Production Global Market Share
Figure WeatherPrufe Waterproof Paint Product Picture
Table WeatherPrufe Waterproof Paint Product Specification
Table 2009-2014 WeatherPrufe Waterproof Paint Product Capacity Production (K Ton) Price Cost Gross (USD/Ton) Production Value (Million USD) Gross Margin List
Figure 2009-2014 WeatherPrufe Waterproof Paint Product Capacity Production (K Ton) and Growth Rate
Figure 2009-2014 WeatherPrufe Waterproof Paint Product Production Global Market Share
Figure Kings Waterproof Paint Product Picture
Table Kings Waterproof Paint Product Specification
Table 2009-2014 Kings Waterproof Paint Product Capacity Production (K Ton) Price Cost Gross (USD/Ton) Production Value (Million USD) Gross Margin List
Figure 2009-2014 Kings Waterproof Paint Product Capacity Production (K Ton) and Growth Rate
Figure 2009-2014 Kings Waterproof Paint Product Production Global Market Share
Figure Paintcor Waterproof Paint Product Picture
Table Paintcor Waterproof Paint Product Specification
Table 2009-2014 Paintcor Waterproof Paint Product Capacity Production (K Ton) Price Cost Gross (USD/Ton) Production Value (Million USD) Gross Margin List
Figure 2009-2014 Paintcor Waterproof Paint Product Capacity Production (K Ton) and Growth Rate
Figure 2009-2014 Paintcor Waterproof Paint Product Production Global Market Share
Figure Weber Waterproof Paint Product Picture
Table Weber Waterproof Paint Product Specification
Table 2009-2014 Weber Waterproof Paint Product Capacity Production (K Ton) Price Cost Gross (USD/Ton) Production Value (Million USD) Gross Margin List
Figure 2009-2014 Weber Waterproof Paint Product Capacity Production (K Ton) and Growth Rate
Figure 2009-2014 Weber Waterproof Paint Product Production Global Market Share
Figure Megabond Waterproof Paint Product Picture
Table Megabond Waterproof Paint Product Specification
Table 2009-2014 Megabond Waterproof Paint Product Capacity Production (K Ton) Price Cost Gross (USD/Ton) Production Value (Million USD) Gross Margin List
Figure 2009-2014 Megabond Waterproof Paint Product Capacity Production (K Ton) and Growth Rate
Figure 2009-2014 Megabond Waterproof Paint Product Production Global Market Share
Figure Dampsure Waterproof Paint Product Picture
Table Dampsure Waterproof Paint Product Specification
Table 2009-2014 Dampsure Waterproof Paint Product Capacity Production (K Ton) Price Cost Gross (USD/Ton) Production Value (Million USD) Gross Margin List
Figure 2009-2014 Dampsure Waterproof Paint Product Capacity Production (K Ton) and Growth Rate
Figure 2009-2014 Dampsure Waterproof Paint Product Production Global Market Share
Figure MEDAL Waterproof Paint Product Picture
Table MEDAL Waterproof Paint Product Specification
Table 2009-2014 MEDAL Waterproof Paint Product Capacity Production (K Ton) Price Cost Gross (USD/Ton) Production Value (Million USD) Gross Margin List
Figure 2009-2014 MEDAL Waterproof Paint Product Capacity Production (K Ton) and Growth Rate
Figure 2009-2014 MEDAL Waterproof Paint Product Production Global Market Share
Figure HERITAGE Waterproof Paint Product Picture
Table HERITAGE Waterproof Paint Product Specification
Table 2009-2014 HERITAGE Waterproof Paint Product Capacity Production (K Ton) Price Cost Gross (USD/Ton) Production Value (Million USD) Gross Margin List
Figure 2009-2014 HERITAGE Waterproof Paint Product Capacity Production (K Ton) and Growth Rate
Figure 2009-2014 HERITAGE Waterproof Paint Product Production Global Market Share
Figure STONCOR Waterproof Paint Product Picture
Table STONCOR Waterproof Paint Product Specification
Table 2009-2014 STONCOR Waterproof Paint Product Capacity Production (K Ton) Price Cost Gross (USD/Ton) Production Value (Million USD) Gross Margin List
Figure 2009-2014 STONCOR Waterproof Paint Product Capacity Production (K Ton) and Growth Rate
Figure 2009-2014 STONCOR Waterproof Paint Product Production Global Market Share
Figure DEKOR Waterproof Paint Product Picture
Table DEKOR Waterproof Paint Product Specification
Table 2009-2014 DEKOR Waterproof Paint Product Capacity Production (K Ton) Price Cost Gross (USD/Ton) Production Value (Million USD) Gross Margin List
Figure 2009-2014 DEKOR Waterproof Paint Product Capacity Production (K Ton) and Growth Rate
Figure 2009-2014 DEKOR Waterproof Paint Product Production Global Market Share
Figure Darachem Waterproof Paint Product Picture
Table Darachem Waterproof Paint Product Specification
Table 2009-2014 Darachem Waterproof Paint Product Capacity Production (K Ton) Price Cost Gross (USD/Ton) Production Value (Million USD) Gross Margin List
Figure 2009-2014 Darachem Waterproof Paint Product Capacity Production (K Ton) and Growth Rate
Figure 2009-2014 Darachem Waterproof Paint Product Production Global Market Share
Figure ROBEX SA Waterproof Paint Product Picture
Table ROBEX SA Waterproof Paint Product Specification
Table 2009-2014 ROBEX SA Waterproof Paint Product Capacity Production (K Ton) Price Cost Gross (USD/Ton) Production Value (Million USD) Gross Margin List
Figure 2009-2014 ROBEX SA Waterproof Paint Product Capacity Production (K Ton) and Growth Rate
Figure 2009-2014 ROBEX SA Waterproof Paint Product Production Global Market Share
Figure RETEK Waterproof Paint Product Picture
Table RETEK Waterproof Paint Product Specification
Table 2009-2014 RETEK Waterproof Paint Product Capacity Production (K Ton) Price Cost Gross (USD/Ton) Production Value (Million USD) Gross Margin List
Figure 2009-2014 RETEK Waterproof Paint Product Capacity Production (K Ton) and Growth Rate
Figure 2009-2014 RETEK Waterproof Paint Product Production Global Market Share
Table 2014-2020 South Africa Waterproof Paint Demand Forecast
Table 2014-2020 South Africa Waterproof Paint Capacity Production Forecast
Table 2014-2020 South Africa Waterproof Paint Capacity Production (K Ton) Price Cost Gross (USD/Ton) Production Value (Million USD) Gross Margin List
Table 2014-2020 Waterproof Paint Industry Segment Market Structure (by Region)
Table 2014-2020 Waterproof Paint Industry Segment Market Structure (by Product)
Table Waterproof Paint New Project SWOT Analysis
Table 10 K Ton/Year Waterproof Paint New Project Investment Feasibility Analysis
本报告所有内容受法律保护,中华人民共和国涉外调查许可证:国统涉外证字第1454号。 本报告由中商产业研究院出品,报告版权归中商产业研究院所有。本报告是中商产业研究院的研究与统计成果,报告为有偿提供给购买报告的客户内部使用。未获得中商产业研究院书面授权,任何网站或媒体不得转载或引用,否则中商产业研究院有权依法追究其法律责任。如需订阅研究报告,请直接联系本网站,以便获得全程优质完善服务。 本报告目录与内容系中商产业研究院原创,未经本公司事先书面许可,拒绝任何方式复制、转载。 在此,我们诚意向您推荐鉴别咨询公司实力的主要方法。
2月17日,遵义市招商营商业务专题培训会召开,中商产业董事长、研究院执行院长杨云(客座教授)应邀为培训...
2月17日,遵义市招商营商业务专题培训会召开,中商产业董事长、研究院执行院长杨云(客座教授)应邀为培训...
查看详情
近日,中商产业研究院专家团队赴滁州市开展《滁州市制造业数字化、网络化、智能化、绿色化发展的堵点及对策...
近日,中商产业研究院专家团队赴滁州市开展《滁州市制造业数字化、网络化、智能化、绿色化发展的堵点及对策...
查看详情
2024年12月27日,昆明市发展和改革委员会组织召开《“十五五”时期提升昆明服务业竞争力对策研究》专家评审...
2024年12月27日,昆明市发展和改革委员会组织召开《“十五五”时期提升昆明服务业竞争力对策研究》专家评审...
查看详情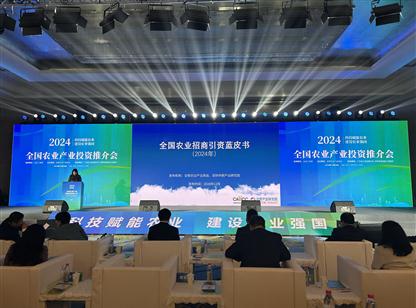
12月25日,2024年全国农业产业高质量发展大会暨2024年全国农业产业投资推介会在深圳市隆重开幕。此次盛会以...
12月25日,2024年全国农业产业高质量发展大会暨2024年全国农业产业投资推介会在深圳市隆重开幕。此次盛会以...
查看详情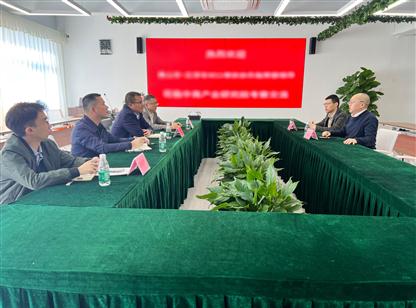
近日,广东省云浮市政府党组成员、佛山市-云浮市对口帮扶协作指挥部指挥长,佛云园党工委书记、管委会主任...
近日,广东省云浮市政府党组成员、佛山市-云浮市对口帮扶协作指挥部指挥长,佛云园党工委书记、管委会主任...
查看详情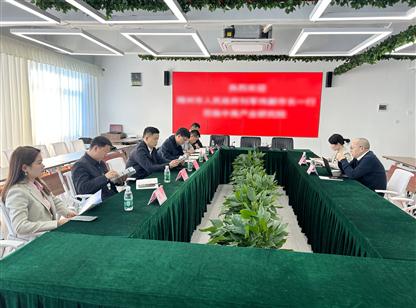
近日,湖北省随州市人民政府党组成员刘军伟一行莅临我院考察交流,会上刘军伟介绍了随州市的产业基础及现状...
近日,湖北省随州市人民政府党组成员刘军伟一行莅临我院考察交流,会上刘军伟介绍了随州市的产业基础及现状...
查看详情
12月18日,由贵州省人民政府驻广州办事处主办的省驻粤招商工作基金招商专题培训会在深圳中商产业研究院项目...
12月18日,由贵州省人民政府驻广州办事处主办的省驻粤招商工作基金招商专题培训会在深圳中商产业研究院项目...
查看详情
12月13日下午,河北省发展和改革委员会规划处、人事处组织开展发改大讲堂“十五五”规划编制系列专题培训,...
12月13日下午,河北省发展和改革委员会规划处、人事处组织开展发改大讲堂“十五五”规划编制系列专题培训,...
查看详情